Case study: Enhancing telecommunications connectivity through data analytics
Case study: Enhancing telecommunications connectivity through data analytics
22 February, 2024 •The Government of Rwanda’s ambitious plan to become a cashless economy by 2024 has seen significant efforts and investments in the cashless and digitalisation agenda. These initiatives have led to the adoption of mobile money as one of the most popular financial transaction channels.
During the Covid-19 pandemic, the value of mobile money transactions grew from RWF 3 trillion in 2019 to RWF 10 trillion in 2021. However, with recent data revealing a tapering in this growth rate, the Government of Rwanda is looking for new avenues to increase the share of cashless transactions and maintain the momentum of digitalisation efforts.
Through the Rwanda Economy Digitalisation programme, we conducted a qualitative survey among farmers and retailers in rural areas to understand issues affecting digital financial inclusion in the country. The study showed that, despite the general perception of good network coverage, poor connectivity was a significant barrier to the adoption of digital transactions. In this case study we look at how data was utilised to better understand and develop potential solutions for the connectivity issues in the country.
What was the problem?
Network accessibility is a pre-requisite for the use of all mobile services. Currently, network accessibility in Rwanda is insufficient to support mobile money transactions, data connectivity and voice connectivity in certain parts of the country.
Analysis revealed that the network infrastructure outside urban areas is at risk of becoming overburdened during peak periods, leading to suboptimal connectivity and, consequently, adversely affecting digital transactions. This deficiency in connectivity emerged as a significant barrier to the widespread adoption of cashless transactions, reflecting both infrastructure and device barriers.
The analyses further highlighted the financial repercussions of poor network access, particularly in terms of slow or failed mobile money transactions, emphasising the need for proactive measures. Examples of failed mobile money transactions include unexpected USSD or transaction timeouts and instances where money paid out of the payer’s wallet does not end up in the receiver’s wallet. In some instances, money may even be added to a receiver’s wallet without any corresponding deduction in the payer’s wallet. Although such failures are events, an International Telecommunication Union ITU pilot study in Ghana indicated that the location of the transaction plays a role in the probability of a successful transaction, and areas with poorer network coverage often had a higher rate of failed transactions.
While the Rwanda Utilities Regulatory Authority (RURA) monitors Quality of Service (QoS) indicators, these do not cover the full usage journey, making it impossible to assess which aspects of users’ mobile service journeys have poor QoS. Furthermore, many QoS indicators are currently measured at a provincial level, which obscures problem areas within a provincial average.
How data was used to pinpoint connectivity issues
In collaboration with our partners at 71point4, we analysed the results from the qualitative survey on digital financial inclusion and conducted an in-depth examination of telecom data sourced from RURA. The initial phase involved assessing the QoS and the load on telecommunication towers to identify stress points within the network infrastructure. The distribution of towers across the country was investigated, offering valuable insights into regional variations and potential connectivity gaps.
Datasets used
The data utilised in the analysis comprised Call Detail Records (CDR), which included every call, SMS, and data connection made on MTN and Airtel’s networks for January and August 2020. In addition, cell tower information, including the number of towers and their location for 2021 and 2022, was obtained.
The data received did not include information on failed calls or failed transactions. Consequently, several metrics were employed to measure connectivity including the number of cell phone towers per administrative region down to the sector level. A load metric was also used, which accounted for the number of voice and SMS connections that each tower handles during peak hours. Towers with a higher load are likely to experience more connectivity issues.
What did this data tell us?
Universal access: The analysis revealed that despite significant infrastructure investment by Mobile Network Operators (MNOs), towers outside of Kigali City are more thinly distributed among the population. For example, Gasabo district boasts over 3,760 towers, which based on its population, results in approximately 232 people per tower. In contrast, Gatsibo in the Eastern province has just 461 towers, translating to approximately 1,300 people per tower. As of 2022, there were 42 sectors that did not contain a single tower.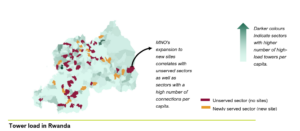
Capacity to facilitate transactions and other telecommunication services: The analysis considered the load on each tower during peak times. The load on MNO’s infrastructure grew significantly in 2020, with the number of connections over peak hours increasing by 30% between January 2020 and August 2020. An examination of tower load per district indicates that highly burdened infrastructure is found outside of Kigali, with the Eastern province, in particular, having a high number of connections per tower. A high load per tower increases the likelihood of failed transactions and a lower quality of service.
Recommended solutions
The findings found from this analysis were shared with key stakeholders, including RURA, MNOs, the Rwanda Information Society Authority (RISA), and the Ministry of ICT & Innovation (MINICT). The collaborative dissemination of this analysis served to enhance the collective understanding of the existing connectivity landscape and laid the groundwork for informed decision-making.
Solutions recommended to address this connectivity issue include:
- The adoption of a set of Quality-of-Service metrics to be monitored in future by the supervisory or regulatory body.
- A strategy for the construction of new towers across the country to ensure universal access to the telecommunication network and sufficient capacity to effectively facilitate digital payments and other telecommunication services.
Results
As a result, the Government of Rwanda committed to deploying 100 new sites by the end of 2023 and achieving 100% network coverage within 3 years. MINICT appointed a task team within RURA, to investigate connectivity issues, identifying 42 regions with limited access. Subsequently, MINICT engaged with mobile operators to improve coverage in these areas.
The programme leveraged earlier insights obtained from the analysis of data in the transport sector, highlighting the practical value of data-driven recommendations.
How data can be used to solve difficult policy problems:
- Data plays a pivotal role in generating detailed insights in a cost-effective manner, enabling the tracking of issues such as poor connectivity down to the cell level. This assists in quickly identifying and addressing challenges faced by the most excluded segments of the population.
- The government gains the ability to independently analyse its own data, reducing reliance on external reports from service providers and enhancing the overall quality of information at its disposal.
- The specificity of the data further facilitates meticulous planning, allowing for targeted and detailed strategies.
- Going forward, this data-driven approach empowers the government to hold service providers accountable, ensuring that specific data is consistently available and analysed, thereby adopting a proactive and accountable governance system.
The recognition of the importance of data and analytics in decision-making by both the regulator and the MINICT marks a significant shift toward a more data-driven culture and highlights the importance of considering underlying infrastructure when policymakers design policies around outcomes like the cashless agenda. This framework positions RURA as a forward-thinking regulatory body, leveraging data to drive positive outcomes and advance sustainable development in Rwanda. The sustainability of the study is demonstrated by the continued use of data analysis in decision-making processes and the initiation of more projects leveraging data within RURA.
For more information email info@cenfri.org.