Sizing the ‘grey economy’: Using geospatial data to uncover the true extent of the MSME sector in emerging markets
Sizing the ‘grey economy’: Using geospatial data to uncover the true extent of the MSME sector in emerging markets
19 February, 2020 •The micro, small and medium enterprise (MSME) sector is arguably the biggest employer in many economies, particularly in the developing world. It’s also often the biggest source of jobs for marginalised segments such as women, youth and poor communities.
But exactly how big is the sector, and how many jobs is it producing? Those are hard questions to answer, due to the large proportion of informal enterprises that fall below the radar of formal regulation and compliance in emerging markets. This makes the sizing of the MSME sector a huge challenge, leading some researchers to describe it as a “grey sector.”
Various methodologies have been used in an attempt to size the sector, with minimal or inconclusive findings on MSMEs’ total contribution to emerging economies – particularly their contribution to GDP. What is clear is that informal businesses far outnumber formal ones. Past attempts at sizing the informal sector have largely relied on household sampling, such as the second generation of the FinScope MSME survey (see Eswatini for a recent example), business censuses conducted by statistics offices, and cluster sampling approaches. These efforts have led to significant improvements in sizing the informal business (and broader MSME) sectors – however, they still have considerable limitations.
In response to these issues, FinMark Trust has leveraged improvements in technology and geospatial data modeling techniques to develop a new FinScope MSME sampling methodology. Our approach is based on the learnings we generated from our Lesotho (2015) and Eswatini (2017) FinScope MSME surveys, and it was first deployed in Malawi in 2019. Below, we’ll explore how this effort worked in Malawi and why it’s a promising model for other countries.
The first step in surveying MSMEs: Finding the areas where they’re located
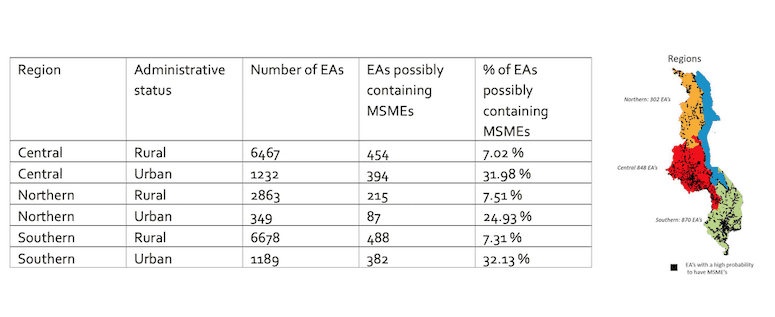
The thinking behind this new methodology was simple. For the purposes of this survey, the study used thousands of geographic segments called enumeration areas (EAs). A nationally representative sampling technique demands that all these EAs have an equal chance of selection – but not all EAs have the same probability of having commercial areas, let alone MSMEs. Hence, we collaborated with the National Statistics Office of Malawi and GeoTerraImage to use geospatial data modeling (employing information gathered from satellite imagery and aerial photography) to identify the EAs that could possibly contain MSMEs. This new approach incorporated a number of datasets and spatial analysis techniques to allow for the most accurate results. It identified 2020 high-confidence EAs across Malawi, i.e. those EAs with the highest probability (85-100%) of having MSMEs. It further identified EAs with medium- and low-confidence of MSMEs, (including about 3,600 EAs), and sampled from these areas to generate a representative sample of the whole of Malawi. Table 1 below shows the distribution of EAs with a high probability of having MSMEs, and the distribution of these EAs by region.
Using the approach detailed above, the survey sampled from the EAs identified as having high, medium and low probability of MSMEs. The sampling expert ensured that these selections were representative of all of Malawi, as well as its different regional and urban/rural areas.
Identifying different types of MSMEs
Additionally, to improve the accuracy of the data and the quality of the businesses surveyed, we conducted a comprehensive listing exercise for observed business units (such as shops, garages, salons, workshops, etc.), capturing their size (employee and turnover) and main business activity (sector). We conducted the same listing exercise for household-based businesses in the sampled EA, as most MSMEs operate from their homes. For each EA, we used a sampling frame which included business owners from both the business units and the household-based enterprises. We used this sampling frame to tally up the total number of MSMEs, with the business owner (the survey respondent) being the ultimate sampling unit.
A photo of one business unit listing is shown at the top of this page – note the female survey enumerator in the foreground, and the business owner who’s helping her mark his enterprise as counted.
This approach to MSME sampling allows a fairer representation of MSMEs, and potentially improves the size estimation of the MSME sector. The model could be significantly improved if more geospatial data were more readily accessible – but though satellite imaging is useful and available, it’s also very costly. Fortunately, statistics bureaus and mapping tech organisations are collecting more and more geographic information systems data in many emerging markets, which makes the mapping of businesses across a country much easier and more readily available. This ensures that the model used for Malawi can be applied to other markets, and significantly improved.
However, though technological improvements have greatly enhanced sampling methodologies – in this case via the use of geospatial techniques – data availability remains the main limitation to this approach. This can be clearly seen in the case of Malawi. We assessed the country’s enumeration areas based on the probability that they might contain MSMEs – not on the actual number of MSMEs, nor their size or formality. The availability of more data can only improve the accuracy of the sampling and sizing of the MSME sector.
Nevertheless, despite this limitation, FinMark Trust’s new methodology allowed for a higher proportion of MSMEs to be surveyed in Malawi. Using number of employees and/or average annual turnover, we listed a total of 27,261 MSMEs, including 147 medium and 3,892 small enterprises spanning from wholesale and trade, to tourism and agriculture. This in itself creates a database for further studies to be conducted on these business owners, allowing us to take one more step toward a greater understanding of the country’s MSMEs. Ultimately, we hope this and other initiatives will succeed in shining a light on this previously opaque sector, bringing the “grey economy” further out of the darkness, in Malawi and beyond.
This article was first published on Next Billion as part of the Openi2i series an initiative of Cenfri and Finmark Trust.
Thanks for sharing. I read many of your blog posts, cool, your blog is very good.